Glucosamine-6-Phosphate Deaminase
(All numbering and residues are taken from first PDB file)
![]()
![]()
Bending Residue Dihedral Analysis
Residue
iResidue
i+1Distance of hinge axis to residue i in
(A) Distance of hinge axis to residue i in
(A) Change in
(deg) Change in
(deg) Angle of psi(i) axis to hinge axis
(deg) Angle of psi(i) axis to hinge axis
(deg) Percentage Progress
ILE-4
PRO-5
10.0
10.0
-6.7
0.1
23.0
25.1
85.0
PRO-5
LEU-6
9.9
9.9
6.9
-9.0
117.9
117.8
49.8
LEU-6
THR-7
7.4
7.5
-8.6
14.2
30.5
33.0
-77.8
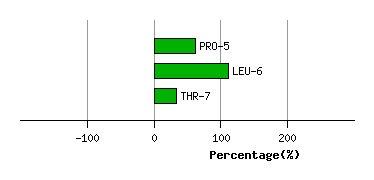
Graph shows rotational transition at bending residues and can be used
to identify hinge bending residues.
Probably only informative for interdomain rotations greater than 20 degrees
Residue
iResidue
i+1Distance of hinge axis to residue i in
(A) Distance of hinge axis to residue i in
(A) Change in
(deg) Change in
(deg) Angle of psi(i) axis to hinge axis
(deg) Angle of psi(i) axis to hinge axis
(deg) Percentage Progress
MET-135
GLY-136
3.4
3.3
4.8
-8.2
67.8
69.9
-25.5
GLY-136
GLY-137
6.4
6.4
-3.7
7.0
166.7
161.7
54.6
GLY-137
VAL-138
7.8
8.0
-1.8
-6.8
92.2
87.3
-2.7

Graph shows rotational transition at bending residues and can be used
to identify hinge bending residues.
Probably only informative for interdomain rotations greater than 20 degrees
Residue
iResidue
i+1Distance of hinge axis to residue i in
(A) Distance of hinge axis to residue i in
(A) Change in
(deg) Change in
(deg) Angle of psi(i) axis to hinge axis
(deg) Angle of psi(i) axis to hinge axis
(deg) Percentage Progress
ASP-141
GLY-142
18.7
18.5
17.2
-17.0
46.3
35.6
-23.1
GLY-142
HIS-143
16.7
16.4
-6.6
0.8
160.7
151.6
-59.1
HIS-143
ILE-144
16.3
16.8
7.1
0.8
70.1
70.6
185.3
ILE-144
ALA-145
13.4
14.2
4.7
-7.8
54.9
69.8
106.0
ALA-145
PHE-146
13.3
13.9
-1.2
19.4
65.2
72.4
-33.4
PHE-146
ASN-147
17.0
17.6
-21.1
10.8
108.8
109.3
-20.2
ASN-147
GLU-148
18.4
18.7
58.6
-27.6
146.3
143.0
-457.4
GLU-148
PRO-149
20.9
21.5
-5.1
-11.9
90.0
88.4
17.1
PRO-149
ALA-150
23.1
22.1
11.9
1.1
42.2
45.5
176.7
ALA-150
SER-151
25.3
24.1
-14.4
30.3
149.3
151.3
170.9

Graph shows rotational transition at bending residues and can be used
to identify hinge bending residues.
Probably only informative for interdomain rotations greater than 20 degrees
Residue
iResidue
i+1Distance of hinge axis to residue i in
(A) Distance of hinge axis to residue i in
(A) Change in
(deg) Change in
(deg) Angle of psi(i) axis to hinge axis
(deg) Angle of psi(i) axis to hinge axis
(deg) Percentage Progress
ALA-154
SER-155
19.9
18.8
-5.9
4.9
104.3
94.2
44.3
SER-155
ARG-156
19.4
19.1
8.6
-18.7
68.5
71.5
60.0
ARG-156
THR-157
17.4
17.2
-9.9
14.5
61.3
64.4
7.1

Graph shows rotational transition at bending residues and can be used
to identify hinge bending residues.
Probably only informative for interdomain rotations greater than 20 degrees
Residue
iResidue
i+1Distance of hinge axis to residue i in
(A) Distance of hinge axis to residue i in
(A) Change in
(deg) Change in
(deg) Angle of psi(i) axis to hinge axis
(deg) Angle of psi(i) axis to hinge axis
(deg) Percentage Progress
VAL-199
MET-200
6.8
6.9
0.0
-1.8
156.1
156.7
-56.1
MET-200
ILE-201
5.2
5.4
-3.1
3.4
127.1
128.9
24.9
ILE-201
LEU-202
6.2
6.4
-4.1
9.8
151.1
151.8
100.9
LEU-202
VAL-203
4.2
4.4
-4.1
3.6
133.7
132.8
-5.9
VAL-203
LEU-204
6.3
6.5
-8.2
0.5
153.3
153.2
-109.1
LEU-204
GLY-205
5.3
5.3
2.4
7.7
46.3
49.2
112.8

Graph shows rotational transition at bending residues and can be used
to identify hinge bending residues.
Probably only informative for interdomain rotations greater than 20 degrees
Residue
iResidue
i+1Distance of hinge axis to residue i in
(A) Distance of hinge axis to residue i in
(A) Change in
(deg) Change in
(deg) Angle of psi(i) axis to hinge axis
(deg) Angle of psi(i) axis to hinge axis
(deg) Percentage Progress
PRO-233
LYS-234
14.8
14.4
-16.9
0.2
59.4
54.9
123.4
LYS-234
ALA-235
11.9
11.8
4.5
0.7
129.3
134.3
-34.7
ALA-235
ILE-236
10.7
10.8
-3.1
5.3
34.6
34.9
-28.7
ILE-236
MET-237
9.2
9.4
-1.7
5.8
50.0
46.4
-53.7
MET-237
VAL-238
8.4
8.8
-7.4
-0.6
48.4
52.5
90.8

Graph shows rotational transition at bending residues and can be used
to identify hinge bending residues.
Probably only informative for interdomain rotations greater than 20 degrees
Residue
iResidue
i+1Distance of hinge axis to residue i in
(A) Distance of hinge axis to residue i in
(A) Change in
(deg) Change in
(deg) Angle of psi(i) axis to hinge axis
(deg) Angle of psi(i) axis to hinge axis
(deg) Percentage Progress
SER-243
THR-244
9.1
9.1
0.6
9.3
98.2
92.1
31.9
THR-244
MET-245
11.4
11.5
0.3
4.5
42.3
45.6
70.1
MET-245
GLU-246
13.0
13.2
-6.3
-1.5
81.3
77.9
-1.6
GLU-246
LEU-247
16.3
16.5
-0.1
-2.1
57.8
62.1
27.8

Graph shows rotational transition at bending residues and can be used
to identify hinge bending residues.
Probably only informative for interdomain rotations greater than 20 degrees