Hypothetical Transcriptional Regulator In Qaca 5'Region
(All numbering and residues are taken from first PDB file)
![]()
![]()
Bending Residue Dihedral Analysis
Residue
iResidue
i+1Distance of hinge axis to residue i in
(A) Distance of hinge axis to residue i in
(A) Change in
(deg) Change in
(deg) Angle of psi(i) axis to hinge axis
(deg) Angle of psi(i) axis to hinge axis
(deg) Percentage Progress
GLU-58
SER-59
3.9
3.7
25.6
-12.9
24.6
30.4
32.6
SER-59
LYS-60
6.5
6.4
5.9
-3.3
54.6
48.9
13.3
LYS-60
TRP-61
7.6
6.6
-30.6
50.0
116.9
113.4
20.3
TRP-61
GLN-62
4.2
3.1
0.5
-10.1
51.5
41.7
-19.8
GLN-62
GLU-63
2.8
3.2
-18.1
18.5
152.7
147.4
-0.5
GLU-63
GLN-64
5.3
5.5
-1.4
10.5
123.3
118.0
21.4

Graph shows rotational transition at bending residues and can be used
to identify hinge bending residues.
Probably only informative for interdomain rotations greater than 20 degrees
Residue
iResidue
i+1Distance of hinge axis to residue i in
(A) Distance of hinge axis to residue i in
(A) Change in
(deg) Change in
(deg) Angle of psi(i) axis to hinge axis
(deg) Angle of psi(i) axis to hinge axis
(deg) Percentage Progress
LEU-87
THR-88
12.9
12.0
-9.6
14.4
71.2
82.1
-7.7
THR-88
THR-89
12.8
12.8
-19.4
-4.3
105.2
114.6
-33.2
THR-89
GLU-90
9.9
10.4
156.4
62.2
41.5
10.8
-344.2
GLU-90
TYR-91
11.0
10.7
-24.7
60.2
125.2
103.0
17.6
TYR-91
TYR-92
7.7
14.4
-165.3
163.9
116.7
101.4
34.6
TYR-92
TYR-93
5.4
14.0
73.8
-13.0
74.7
76.5
126.6
TYR-93
PRO-94
7.4
10.7
163.9
-3.4
57.1
29.9
381.4
PRO-94
LEU-95
10.4
12.3
-10.1
26.4
170.0
148.1
39.3
LEU-95
GLN-96
8.9
9.5
-66.6
38.2
108.1
110.1
-42.5
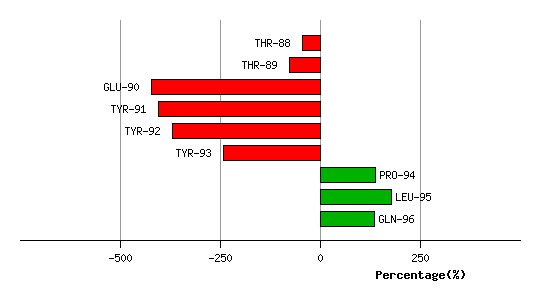
Graph shows rotational transition at bending residues and can be used
to identify hinge bending residues.
Probably only informative for interdomain rotations greater than 20 degrees
Residue
iResidue
i+1Distance of hinge axis to residue i in
(A) Distance of hinge axis to residue i in
(A) Change in
(deg) Change in
(deg) Angle of psi(i) axis to hinge axis
(deg) Angle of psi(i) axis to hinge axis
(deg) Percentage Progress
ASN-117
LYS-118
6.6
8.2
-1.5
-17.7
156.8
145.5
-47.1
LYS-118
LEU-119
7.0
9.3
38.3
-17.5
49.3
48.7
39.9
LEU-119
GLU-120
3.6
5.9
-8.5
-11.0
99.7
124.3
-17.2
GLU-120
ASN-121
5.2
6.1
30.9
-3.8
38.5
46.7
59.0
ASN-121
LYS-122
8.0
9.2
-1.1
-16.9
156.0
150.1
-48.4

Graph shows rotational transition at bending residues and can be used
to identify hinge bending residues.
Probably only informative for interdomain rotations greater than 20 degrees