Uncharacterized Protein
(All numbering and residues are taken from first PDB file)
![]()
![]()
Bending Residue Dihedral Analysis
Residue
iResidue
i+1Distance of hinge axis to residue i in
(A) Distance of hinge axis to residue i in
(A) Change in
(deg) Change in
(deg) Angle of psi(i) axis to hinge axis
(deg) Angle of psi(i) axis to hinge axis
(deg) Percentage Progress
LYS-15
GLY-16
15.5
16.2
-20.5
27.9
97.4
98.1
40.3
GLY-16
GLY-17
12.7
13.4
38.5
-26.1
55.7
66.5
133.1
GLY-17
MET-18
9.3
10.2
-23.4
15.6
57.6
50.9
32.8
MET-18
THR-19
7.4
7.8
-3.0
9.0
14.9
18.7
-76.9
THR-19
SER-20
9.1
9.4
4.0
3.9
100.9
99.3
-28.1

Graph shows rotational transition at bending residues and can be used
to identify hinge bending residues.
Probably only informative for interdomain rotations greater than 20 degrees
Residue
iResidue
i+1Distance of hinge axis to residue i in
(A) Distance of hinge axis to residue i in
(A) Change in
(deg) Change in
(deg) Angle of psi(i) axis to hinge axis
(deg) Angle of psi(i) axis to hinge axis
(deg) Percentage Progress
MET-22
PHE-23
4.7
5.0
1.9
-4.5
44.0
41.3
9.5
PHE-23
ASN-24
7.3
7.6
4.3
-2.9
85.2
84.3
-37.0
ASN-24
ARG-25
7.2
7.5
1.9
-3.0
73.0
74.9
27.4
ARG-25
SER-26
3.7
4.0
7.2
-7.7
4.6
7.1
-14.4

Graph shows rotational transition at bending residues and can be used
to identify hinge bending residues.
Probably only informative for interdomain rotations greater than 20 degrees
Residue
iResidue
i+1Distance of hinge axis to residue i in
(A) Distance of hinge axis to residue i in
(A) Change in
(deg) Change in
(deg) Angle of psi(i) axis to hinge axis
(deg) Angle of psi(i) axis to hinge axis
(deg) Percentage Progress
HIS-252
HIS-253
9.0
9.5
-3.1
1.8
140.3
141.2
-4.5
HIS-253
GLU-254
10.1
10.6
-15.9
8.4
88.1
94.0
36.3
GLU-254
ASN-255
12.3
13.0
-14.0
0.8
125.3
134.6
-235.4
ASN-255
PHE-256
11.4
11.6
-7.0
18.7
146.7
143.7
197.9
PHE-256
ASP-257
12.2
12.5
5.6
-13.5
75.1
78.9
39.5
ASP-257
ASP-258
13.3
13.7
-27.5
30.2
135.3
124.3
39.2
ASP-258
THR-259
13.3
13.1
-7.5
4.6
87.9
83.1
-104.5
THR-259
GLY-260
16.1
16.2
9.6
-5.5
117.5
131.1
-72.8
GLY-260
ALA-261
13.9
14.4
8.0
-4.3
150.9
148.3
-73.4
ALA-261
PHE-262
15.6
15.8
-6.7
-9.9
43.7
37.9
139.2
PHE-262
LYS-263
14.1
14.7
-2.9
-6.7
52.5
54.4
34.1
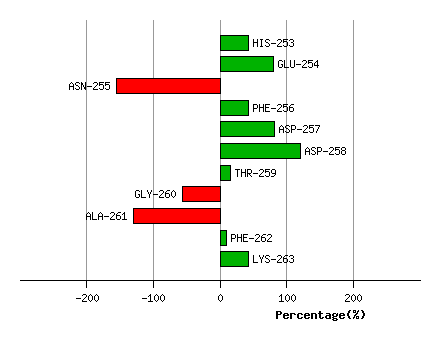
Graph shows rotational transition at bending residues and can be used
to identify hinge bending residues.
Probably only informative for interdomain rotations greater than 20 degrees
Residue
iResidue
i+1Distance of hinge axis to residue i in
(A) Distance of hinge axis to residue i in
(A) Change in
(deg) Change in
(deg) Angle of psi(i) axis to hinge axis
(deg) Angle of psi(i) axis to hinge axis
(deg) Percentage Progress
VAL-281
LEU-282
5.7
5.8
4.9
-5.5
89.1
90.5
-5.1
LEU-282
THR-283
3.4
3.3
-8.9
21.2
125.3
127.8
79.3
THR-283
GLU-284
5.7
5.3
3.0
-14.0
74.6
82.5
-77.0
GLU-284
ALA-285
9.2
8.9
14.2
-7.2
35.1
33.7
78.8
ALA-285
GLN-286
7.9
7.7
-11.4
5.7
77.7
79.8
-77.1
GLN-286
ARG-287
7.0
6.9
9.4
0.5
110.0
115.7
-64.4

Graph shows rotational transition at bending residues and can be used
to identify hinge bending residues.
Probably only informative for interdomain rotations greater than 20 degrees
Residue
iResidue
i+1Distance of hinge axis to residue i in
(A) Distance of hinge axis to residue i in
(A) Change in
(deg) Change in
(deg) Angle of psi(i) axis to hinge axis
(deg) Angle of psi(i) axis to hinge axis
(deg) Percentage Progress
SER-303
ASN-304
5.7
5.5
15.3
-1.8
143.1
137.0
-311.7
ASN-304
PHE-305
4.0
4.4
1.4
-19.2
111.0
114.8
309.1
PHE-305
VAL-306
6.9
7.2
11.0
-2.0
61.8
61.0
99.5

Graph shows rotational transition at bending residues and can be used
to identify hinge bending residues.
Probably only informative for interdomain rotations greater than 20 degrees
Residue
iResidue
i+1Distance of hinge axis to residue i in
(A) Distance of hinge axis to residue i in
(A) Change in
(deg) Change in
(deg) Angle of psi(i) axis to hinge axis
(deg) Angle of psi(i) axis to hinge axis
(deg) Percentage Progress
GLN-401
TYR-402
6.2
6.4
-3.7
2.2
132.5
132.0
-6.4
TYR-402
GLU-403
5.5
5.7
-11.4
19.6
146.2
147.3
27.4
GLU-403
GLY-404
3.9
4.1
5.9
-2.9
60.2
54.7
153.2

Graph shows rotational transition at bending residues and can be used
to identify hinge bending residues.
Probably only informative for interdomain rotations greater than 20 degrees
Residue
iResidue
i+1Distance of hinge axis to residue i in
(A) Distance of hinge axis to residue i in
(A) Change in
(deg) Change in
(deg) Angle of psi(i) axis to hinge axis
(deg) Angle of psi(i) axis to hinge axis
(deg) Percentage Progress
GLN-405
GLY-406
3.0
2.7
14.8
-16.2
68.0
69.0
60.1
GLY-406
LEU-407
6.3
6.0
-16.1
2.7
57.0
54.5
129.9
LEU-407
SER-408
8.6
7.8
5.8
6.6
76.2
79.0
159.3
SER-408
MET-409
12.0
11.0
-7.0
-6.2
123.0
123.8
-97.3
MET-409
ILE-410
11.5
11.4
12.8
-3.8
125.9
120.7
-93.5
ILE-410
GLU-411
11.5
11.4
-2.3
-4.8
61.8
57.2
93.7
GLU-411
ALA-412
14.1
13.6
13.7
-10.2
56.5
59.0
-26.9
ALA-412
MET-413
16.3
15.9
-1.4
2.9
93.3
98.5
13.2
MET-413
ILE-414
16.3
16.3
10.4
-7.9
144.5
140.8
-37.3

Graph shows rotational transition at bending residues and can be used
to identify hinge bending residues.
Probably only informative for interdomain rotations greater than 20 degrees
Residue
iResidue
i+1Distance of hinge axis to residue i in
(A) Distance of hinge axis to residue i in
(A) Change in
(deg) Change in
(deg) Angle of psi(i) axis to hinge axis
(deg) Angle of psi(i) axis to hinge axis
(deg) Percentage Progress
ASP-423
ILE-424
4.8
4.6
24.9
-30.4
80.6
86.1
-52.2
ILE-424
LYS-425
1.6
1.3
5.6
-1.9
43.3
38.1
13.7
LYS-425
TYR-426
1.4
1.5
2.1
0.8
43.4
44.9
29.3
TYR-426
GLY-427
1.2
1.0
3.8
-1.9
114.3
113.0
-28.1
TYR-426
GLY-427
1.2
1.0
3.8
-1.9
114.3
113.0
-28.1

Graph shows rotational transition at bending residues and can be used
to identify hinge bending residues.
Probably only informative for interdomain rotations greater than 20 degrees
Residue
iResidue
i+1Distance of hinge axis to residue i in
(A) Distance of hinge axis to residue i in
(A) Change in
(deg) Change in
(deg) Angle of psi(i) axis to hinge axis
(deg) Angle of psi(i) axis to hinge axis
(deg) Percentage Progress
TYR-426
GLY-427
1.2
1.0
3.8
-1.9
114.3
113.0
-28.1
TYR-426
GLY-427
1.2
1.0
3.8
-1.9
114.3
113.0
-28.1
GLY-427
PRO-428
4.1
3.9
-1.6
-0.2
121.4
119.8
72.6
PRO-428
SER-429
6.8
6.6
0.3
18.8
79.3
74.7
-29.1

Graph shows rotational transition at bending residues and can be used
to identify hinge bending residues.
Probably only informative for interdomain rotations greater than 20 degrees
Residue
iResidue
i+1Distance of hinge axis to residue i in
(A) Distance of hinge axis to residue i in
(A) Change in
(deg) Change in
(deg) Angle of psi(i) axis to hinge axis
(deg) Angle of psi(i) axis to hinge axis
(deg) Percentage Progress
LYS-477
TYR-478
14.3
14.6
-16.4
28.9
134.8
141.7
149.7
TYR-478
SER-479
12.0
12.2
-2.1
4.7
155.5
159.3
72.7
SER-479
THR-480
14.0
14.3
-23.0
-3.7
133.7
133.8
-192.1
THR-480
GLU-481
11.9
12.0
6.5
-8.3
65.3
49.8
96.2
GLU-481
SER-482
14.1
13.8
-1.9
6.5
59.7
67.5
-96.8
SER-482
ILE-483
13.7
13.8
-0.7
3.1
88.8
83.0
18.2
ILE-483
LEU-484
9.9
10.0
4.0
-0.2
31.8
29.0
15.6
LEU-484
GLU-485
9.7
9.6
-4.8
-4.3
97.0
101.8
-8.0

Graph shows rotational transition at bending residues and can be used
to identify hinge bending residues.
Probably only informative for interdomain rotations greater than 20 degrees
Residue
iResidue
i+1Distance of hinge axis to residue i in
(A) Distance of hinge axis to residue i in
(A) Change in
(deg) Change in
(deg) Angle of psi(i) axis to hinge axis
(deg) Angle of psi(i) axis to hinge axis
(deg) Percentage Progress
LYS-486
TRP-487
11.7
11.7
0.9
-1.6
57.7
61.4
35.7
TRP-487
LEU-488
9.1
9.0
-1.6
4.2
140.7
140.4
11.6
LEU-488
ASN-489
11.4
11.3
-3.1
1.5
76.9
77.1
47.8
ASN-489
LEU-490
14.4
14.3
-14.5
17.2
86.0
84.5
-5.1
LEU-490
PHE-491
13.1
12.8
-1.7
-3.2
155.7
147.4
-54.8
PHE-491
ASN-492
12.1
11.8
-20.7
31.2
122.0
123.1
46.9

Graph shows rotational transition at bending residues and can be used
to identify hinge bending residues.
Probably only informative for interdomain rotations greater than 20 degrees