Sam-Dependent Methyltransferases
(All numbering and residues are taken from first PDB file)
![]()
![]()
Bending Residue Dihedral Analysis
Residue
iResidue
i+1Distance of hinge axis to residue i in
(A) Distance of hinge axis to residue i in
(A) Change in
(deg) Change in
(deg) Angle of psi(i) axis to hinge axis
(deg) Angle of psi(i) axis to hinge axis
(deg) Percentage Progress
TYR-165
PHE-166
9.2
9.1
8.5
-16.5
167.0
167.2
52.7
PHE-166
ALA-167
8.3
8.6
1.3
10.8
124.6
125.1
-38.0
ALA-167
ASP-168
12.0
12.2
-4.7
10.1
56.0
44.5
-14.0
ASP-168
ASP-169
13.1
13.2
-10.5
16.0
45.9
40.0
-19.8
ASP-169
PHE-170
10.0
10.0
-18.6
7.6
32.6
39.0
84.1
PHE-170
LEU-171
10.8
11.0
-17.3
10.3
60.6
63.4
55.1

Graph shows rotational transition at bending residues and can be used
to identify hinge bending residues.
Probably only informative for interdomain rotations greater than 20 degrees
Residue
iResidue
i+1Distance of hinge axis to residue i in
(A) Distance of hinge axis to residue i in
(A) Change in
(deg) Change in
(deg) Angle of psi(i) axis to hinge axis
(deg) Angle of psi(i) axis to hinge axis
(deg) Percentage Progress
GLY-188
ARG-189
20.5
20.3
-5.6
1.7
74.4
71.0
-0.3
ARG-189
GLY-190
21.9
21.7
-9.2
36.5
129.4
126.5
150.0
GLY-190
GLN-191
21.2
21.3
-36.2
29.3
74.5
87.8
-16.1
GLN-191
PHE-192
19.0
18.4
-25.4
8.7
143.1
148.6
-103.8
PHE-192
LEU-193
17.2
16.9
-5.4
7.4
129.1
123.6
0.2

Graph shows rotational transition at bending residues and can be used
to identify hinge bending residues.
Probably only informative for interdomain rotations greater than 20 degrees
Residue
iResidue
i+1Distance of hinge axis to residue i in
(A) Distance of hinge axis to residue i in
(A) Change in
(deg) Change in
(deg) Angle of psi(i) axis to hinge axis
(deg) Angle of psi(i) axis to hinge axis
(deg) Percentage Progress
ASP-256
TRP-257
16.9
18.2
-34.7
36.9
116.4
119.9
-2.1
TRP-257
ALA-258
19.5
20.6
-27.4
22.6
125.4
129.1
-22.6
ALA-258
ASP-259
21.4
22.3
19.6
1.5
20.2
22.6
135.1

Graph shows rotational transition at bending residues and can be used
to identify hinge bending residues.
Probably only informative for interdomain rotations greater than 20 degrees
Residue
iResidue
i+1Distance of hinge axis to residue i in
(A) Distance of hinge axis to residue i in
(A) Change in
(deg) Change in
(deg) Angle of psi(i) axis to hinge axis
(deg) Angle of psi(i) axis to hinge axis
(deg) Percentage Progress
ALA-260
ASP-261
23.8
25.1
-21.2
17.2
114.7
113.3
-19.2
ASP-261
ALA-262
24.3
24.8
-9.1
9.7
81.6
74.5
9.7
ALA-262
VAL-263
21.3
21.3
-29.0
8.5
26.9
23.6
158.9
VAL-263
ARG-264
22.4
22.1
-1.8
6.9
90.7
87.4
-24.6

Graph shows rotational transition at bending residues and can be used
to identify hinge bending residues.
Probably only informative for interdomain rotations greater than 20 degrees
Residue
iResidue
i+1Distance of hinge axis to residue i in
(A) Distance of hinge axis to residue i in
(A) Change in
(deg) Change in
(deg) Angle of psi(i) axis to hinge axis
(deg) Angle of psi(i) axis to hinge axis
(deg) Percentage Progress
ILE-283
LEU-284
12.5
12.2
1.1
10.1
118.3
122.0
-77.1
LEU-284
ASP-285
10.2
10.1
28.6
-24.6
123.6
118.9
-30.5
ASP-285
SER-286
8.8
8.0
-14.5
1.5
98.4
93.5
51.5
SER-286
VAL-287
6.7
5.2
-1.6
13.5
145.7
136.8
147.9
VAL-287
ILE-288
6.3
5.7
1.5
10.6
96.4
90.2
10.3

Graph shows rotational transition at bending residues and can be used
to identify hinge bending residues.
Probably only informative for interdomain rotations greater than 20 degrees
Residue
iResidue
i+1Distance of hinge axis to residue i in
(A) Distance of hinge axis to residue i in
(A) Change in
(deg) Change in
(deg) Angle of psi(i) axis to hinge axis
(deg) Angle of psi(i) axis to hinge axis
(deg) Percentage Progress
GLU-307
GLY-308
18.9
18.5
2.5
14.5
166.3
155.4
-123.3
GLY-308
GLU-309
17.5
16.6
-28.6
11.1
72.1
73.4
-20.4
GLU-309
HIS-310
14.7
14.2
3.4
-2.6
129.8
130.8
0.9
HIS-310
ARG-311
11.9
11.1
-8.7
-25.5
11.4
26.3
271.8
ARG-311
THR-312
11.9
11.5
-22.8
48.2
62.4
56.8
-116.7
THR-312
ARG-313
9.9
9.9
-4.5
-3.6
37.8
44.6
55.7
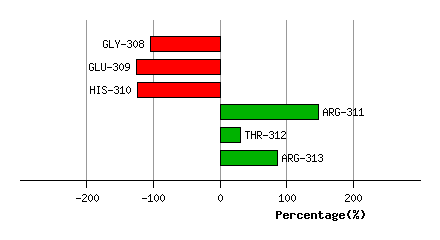
Graph shows rotational transition at bending residues and can be used
to identify hinge bending residues.
Probably only informative for interdomain rotations greater than 20 degrees
Residue
iResidue
i+1Distance of hinge axis to residue i in
(A) Distance of hinge axis to residue i in
(A) Change in
(deg) Change in
(deg) Angle of psi(i) axis to hinge axis
(deg) Angle of psi(i) axis to hinge axis
(deg) Percentage Progress
GLY-334
ASP-335
5.8
6.1
-14.2
25.5
104.0
98.5
-55.7
ASP-335
VAL-336
3.8
4.0
-9.3
4.1
75.2
79.3
-6.6
VAL-336
TRP-337
0.3
0.6
-12.4
13.9
127.3
130.6
8.3
TRP-337
ALA-338
3.5
3.8
-7.6
0.0
158.6
158.8
-56.5

Graph shows rotational transition at bending residues and can be used
to identify hinge bending residues.
Probably only informative for interdomain rotations greater than 20 degrees