Autoinducer 2-Binding Periplasmic Protein Luxp
(All numbering and residues are taken from first PDB file)
![]()
![]()
Bending Residue Dihedral Analysis
Residue
iResidue
i+1Distance of hinge axis to residue i in
(A) Distance of hinge axis to residue i in
(A) Change in
(deg) Change in
(deg) Angle of psi(i) axis to hinge axis
(deg) Angle of psi(i) axis to hinge axis
(deg) Percentage Progress
GLY-177
PHE-178
3.9
4.6
8.9
-4.2
113.5
106.9
-2.5
PHE-178
ASP-179
1.6
2.2
2.1
22.2
44.1
43.2
51.6
ASP-179
HIS-180
2.5
2.8
-9.2
0.1
79.9
82.5
7.9
HIS-180
ALA-181
6.3
6.6
0.1
4.9
75.8
73.6
3.2
ALA-181
GLU-182
7.6
7.7
-3.1
-5.2
51.6
47.5
18.8

Graph shows rotational transition at bending residues and can be used
to identify hinge bending residues.
Probably only informative for interdomain rotations greater than 20 degrees
Residue
iResidue
i+1Distance of hinge axis to residue i in
(A) Distance of hinge axis to residue i in
(A) Change in
(deg) Change in
(deg) Angle of psi(i) axis to hinge axis
(deg) Angle of psi(i) axis to hinge axis
(deg) Percentage Progress
VAL-308
MET-309
9.2
9.4
-6.3
9.4
107.4
112.0
3.4
MET-309
ARG-310
6.1
6.4
-3.7
-16.0
65.7
66.5
5.3
ARG-310
MET-311
2.8
3.2
12.0
6.8
41.0
43.8
48.2
MET-311
ASN-312
0.8
0.1
-10.4
14.5
73.7
77.0
27.7
ASN-312
ASP-313
3.5
3.8
-10.3
4.3
81.2
82.7
5.4

Graph shows rotational transition at bending residues and can be used
to identify hinge bending residues.
Probably only informative for interdomain rotations greater than 20 degrees
Residue
iResidue
i+1Distance of hinge axis to residue i in
(A) Distance of hinge axis to residue i in
(A) Change in
(deg) Change in
(deg) Angle of psi(i) axis to hinge axis
(deg) Angle of psi(i) axis to hinge axis
(deg) Percentage Progress
VAL-335
TYR-336
7.0
6.8
5.5
-1.6
149.9
149.5
-5.1
TYR-336
SER-337
6.2
5.9
-2.5
-11.1
66.1
64.4
24.3
SER-337
GLY-338
3.1
2.7
1.2
-16.1
160.2
153.9
53.0
GLY-338
ASP-339
3.1
2.5
12.8
-29.2
105.4
94.8
18.4
ASP-339
PHE-340
4.4
3.5
20.1
-6.0
108.7
124.8
-14.0
PHE-340
GLU-341
5.1
4.9
15.0
-11.5
130.0
129.6
-12.5
GLU-341
ILE-342
7.6
7.4
-2.8
-8.0
83.9
85.3
26.8
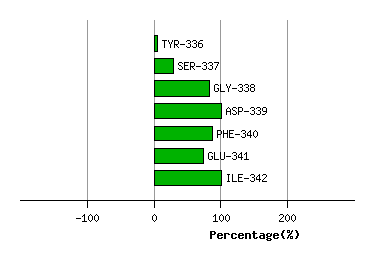
Graph shows rotational transition at bending residues and can be used
to identify hinge bending residues.
Probably only informative for interdomain rotations greater than 20 degrees
Residue
iResidue
i+1Distance of hinge axis to residue i in
(A) Distance of hinge axis to residue i in
(A) Change in
(deg) Change in
(deg) Angle of psi(i) axis to hinge axis
(deg) Angle of psi(i) axis to hinge axis
(deg) Percentage Progress
ALA-354
LEU-355
4.8
4.4
-0.9
-2.6
18.0
24.4
7.2
LEU-355
LYS-356
4.1
3.5
1.3
-3.5
92.6
88.6
4.1
LYS-356
LYS-357
1.5
1.9
9.8
1.8
80.6
80.3
-0.2
LYS-357
ARG-358
2.0
1.7
-1.4
-8.7
38.8
32.4
23.5
ARG-358
ALA-359
3.8
2.9
-2.3
-5.8
45.0
52.0
30.4

Graph shows rotational transition at bending residues and can be used
to identify hinge bending residues.
Probably only informative for interdomain rotations greater than 20 degrees