Cog0147: Anthranilate/para-Aminobenzoate Synthases Component I
(All numbering and residues are taken from first PDB file)
![]()
![]()
Bending Residue Dihedral Analysis
Residue
iResidue
i+1Distance of hinge axis to residue i in
(A) Distance of hinge axis to residue i in
(A) Change in
(deg) Change in
(deg) Angle of psi(i) axis to hinge axis
(deg) Angle of psi(i) axis to hinge axis
(deg) Percentage Progress
ASN-25
PRO-26
19.0
19.1
-23.1
-2.6
59.6
62.8
155.0
PRO-26
ALA-27
15.9
15.9
0.6
-9.4
61.5
61.1
-55.3
ALA-27
ASP-28
13.6
13.5
5.2
0.9
96.7
92.4
26.4

Graph shows rotational transition at bending residues and can be used
to identify hinge bending residues.
Probably only informative for interdomain rotations greater than 20 degrees
Residue
iResidue
i+1Distance of hinge axis to residue i in
(A) Distance of hinge axis to residue i in
(A) Change in
(deg) Change in
(deg) Angle of psi(i) axis to hinge axis
(deg) Angle of psi(i) axis to hinge axis
(deg) Percentage Progress
ALA-35
VAL-36
13.1
12.4
-8.6
1.7
143.1
144.6
-75.7
VAL-36
VAL-37
15.2
14.7
2.2
-2.8
41.5
33.9
22.2
VAL-37
THR-38
12.7
12.2
-16.1
12.6
75.8
84.5
-32.5
THR-38
GLU-39
13.2
11.4
-23.3
23.0
71.8
68.5
-28.4
ASP-42
GLU-43
15.0
14.4
-103.8
55.3
120.5
94.1
-151.9
GLU-43
ASP-44
11.4
10.7
2.7
-5.8
131.4
151.2
-1.5
ASP-44
TYR-45
8.4
8.4
8.4
4.7
77.0
79.0
1.0
TYR-45
LEU-46
5.1
5.0
-0.3
-0.9
141.8
140.5
-3.1
TYR-45
LEU-46
5.1
5.0
-0.3
-0.9
141.8
140.5
-3.1

Graph shows rotational transition at bending residues and can be used
to identify hinge bending residues.
Probably only informative for interdomain rotations greater than 20 degrees
Residue
iResidue
i+1Distance of hinge axis to residue i in
(A) Distance of hinge axis to residue i in
(A) Change in
(deg) Change in
(deg) Angle of psi(i) axis to hinge axis
(deg) Angle of psi(i) axis to hinge axis
(deg) Percentage Progress
TYR-45
LEU-46
5.1
5.0
-0.3
-0.9
141.8
140.5
-3.1
TYR-45
LEU-46
5.1
5.0
-0.3
-0.9
141.8
140.5
-3.1
LEU-46
LEU-47
2.1
2.0
1.0
-3.1
97.8
100.2
16.9
LEU-47
TYR-48
4.1
4.0
2.7
-2.2
55.2
54.5
-1.5
TYR-48
GLU-49
5.0
5.2
-2.8
11.5
88.6
86.8
-8.8

Graph shows rotational transition at bending residues and can be used
to identify hinge bending residues.
Probably only informative for interdomain rotations greater than 20 degrees
Residue
iResidue
i+1Distance of hinge axis to residue i in
(A) Distance of hinge axis to residue i in
(A) Change in
(deg) Change in
(deg) Angle of psi(i) axis to hinge axis
(deg) Angle of psi(i) axis to hinge axis
(deg) Percentage Progress
ALA-58
GLY-59
4.7
4.6
-5.2
5.5
50.4
50.9
-0.3
GLY-59
VAL-60
6.5
6.5
-18.3
16.1
87.7
88.6
10.2
VAL-60
GLN-61
7.0
7.2
-5.2
1.9
22.2
22.4
40.8

Graph shows rotational transition at bending residues and can be used
to identify hinge bending residues.
Probably only informative for interdomain rotations greater than 20 degrees
Residue
iResidue
i+1Distance of hinge axis to residue i in
(A) Distance of hinge axis to residue i in
(A) Change in
(deg) Change in
(deg) Angle of psi(i) axis to hinge axis
(deg) Angle of psi(i) axis to hinge axis
(deg) Percentage Progress
SER-136
PRO-137
5.4
5.4
0.3
4.7
83.9
81.1
88.5
PRO-137
ARG-138
2.4
2.5
-4.2
1.5
160.2
161.9
-38.9
ARG-138
THR-139
3.4
3.6
1.4
0.0
78.4
77.0
23.1

Graph shows rotational transition at bending residues and can be used
to identify hinge bending residues.
Probably only informative for interdomain rotations greater than 20 degrees
Residue
iResidue
i+1Distance of hinge axis to residue i in
(A) Distance of hinge axis to residue i in
(A) Change in
(deg) Change in
(deg) Angle of psi(i) axis to hinge axis
(deg) Angle of psi(i) axis to hinge axis
(deg) Percentage Progress
VAL-178
ASP-179
12.3
11.9
-9.5
19.2
148.9
150.4
81.4
ASP-179
VAL-180
10.9
10.9
1.7
-12.6
94.3
97.5
-13.5
VAL-180
SER-181
7.1
7.3
6.1
-1.7
25.1
28.6
65.0

Graph shows rotational transition at bending residues and can be used
to identify hinge bending residues.
Probably only informative for interdomain rotations greater than 20 degrees
Residue
iResidue
i+1Distance of hinge axis to residue i in
(A) Distance of hinge axis to residue i in
(A) Change in
(deg) Change in
(deg) Angle of psi(i) axis to hinge axis
(deg) Angle of psi(i) axis to hinge axis
(deg) Percentage Progress
ARG-210
CYS-211
7.0
7.0
1.2
1.4
45.5
49.3
5.5
CYS-211
VAL-212
7.6
7.5
3.0
-9.5
118.0
122.4
32.6
VAL-212
GLU-213
7.8
7.9
8.7
4.2
45.3
45.8
98.1
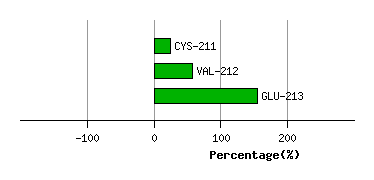
Graph shows rotational transition at bending residues and can be used
to identify hinge bending residues.
Probably only informative for interdomain rotations greater than 20 degrees
Residue
iResidue
i+1Distance of hinge axis to residue i in
(A) Distance of hinge axis to residue i in
(A) Change in
(deg) Change in
(deg) Angle of psi(i) axis to hinge axis
(deg) Angle of psi(i) axis to hinge axis
(deg) Percentage Progress
THR-223
TYR-224
11.7
11.7
-0.2
-0.2
76.8
74.6
15.0
TYR-224
ARG-225
9.5
9.6
-0.8
-0.8
87.3
84.6
1.2
ARG-225
LEU-226
12.9
13.0
4.4
0.4
27.0
30.8
60.1

Graph shows rotational transition at bending residues and can be used
to identify hinge bending residues.
Probably only informative for interdomain rotations greater than 20 degrees
Residue
iResidue
i+1Distance of hinge axis to residue i in
(A) Distance of hinge axis to residue i in
(A) Change in
(deg) Change in
(deg) Angle of psi(i) axis to hinge axis
(deg) Angle of psi(i) axis to hinge axis
(deg) Percentage Progress
GLY-227
ARG-228
11.1
11.7
-0.9
0.0
113.9
119.8
-6.1
ARG-228
ARG-229
11.9
12.4
-6.8
13.2
78.7
86.0
-63.4
ARG-229
HIS-230
15.4
16.1
-9.5
5.0
29.2
38.0
27.4
HIS-230
ASN-231
14.2
15.7
2.7
-4.8
92.3
95.9
31.8
ASN-231
THR-232
11.9
13.7
20.7
-1.6
29.5
28.3
245.3
THR-232
PRO-233
13.5
14.3
9.7
4.5
84.6
98.0
-39.4

Graph shows rotational transition at bending residues and can be used
to identify hinge bending residues.
Probably only informative for interdomain rotations greater than 20 degrees
Residue
iResidue
i+1Distance of hinge axis to residue i in
(A) Distance of hinge axis to residue i in
(A) Change in
(deg) Change in
(deg) Angle of psi(i) axis to hinge axis
(deg) Angle of psi(i) axis to hinge axis
(deg) Percentage Progress
SER-236
PHE-237
6.5
6.7
-1.2
-0.6
44.0
45.1
6.6
PHE-237
LEU-238
3.6
3.7
-0.6
0.6
102.0
102.6
-2.7
LEU-238
LEU-239
4.3
4.2
3.0
-3.1
134.5
133.6
-11.0

Graph shows rotational transition at bending residues and can be used
to identify hinge bending residues.
Probably only informative for interdomain rotations greater than 20 degrees
Residue
iResidue
i+1Distance of hinge axis to residue i in
(A) Distance of hinge axis to residue i in
(A) Change in
(deg) Change in
(deg) Angle of psi(i) axis to hinge axis
(deg) Angle of psi(i) axis to hinge axis
(deg) Percentage Progress
ALA-246
LEU-247
5.0
4.8
0.6
-1.1
78.1
77.4
-7.8
LEU-247
GLY-248
3.7
3.7
0.7
2.3
137.2
137.3
-26.1
GLY-248
TYR-249
2.9
3.1
-3.2
1.1
100.9
99.7
11.7
TYR-249
SER-250
6.0
6.3
-24.2
62.5
71.0
68.8
-79.7
SER-250
PRO-251
7.2
7.0
27.2
-6.3
85.3
121.0
-53.9
PRO-251
GLU-252
10.9
9.6
4.8
-45.6
86.3
74.5
-101.7
GLU-252
LEU-253
11.6
11.6
12.6
2.7
33.9
20.8
156.0
LEU-253
VAL-254
12.9
12.9
-9.4
7.9
74.1
81.8
54.6

Graph shows rotational transition at bending residues and can be used
to identify hinge bending residues.
Probably only informative for interdomain rotations greater than 20 degrees
Residue
iResidue
i+1Distance of hinge axis to residue i in
(A) Distance of hinge axis to residue i in
(A) Change in
(deg) Change in
(deg) Angle of psi(i) axis to hinge axis
(deg) Angle of psi(i) axis to hinge axis
(deg) Percentage Progress
ARG-405
ALA-406
2.5
2.8
-36.1
18.9
141.3
140.7
-172.9
ALA-406
ALA-407
1.4
1.3
-8.7
5.6
71.4
70.5
15.1
ALA-407
TYR-408
4.9
4.7
5.6
-2.8
43.4
44.4
21.6

Graph shows rotational transition at bending residues and can be used
to identify hinge bending residues.
Probably only informative for interdomain rotations greater than 20 degrees
Residue
iResidue
i+1Distance of hinge axis to residue i in
(A) Distance of hinge axis to residue i in
(A) Change in
(deg) Change in
(deg) Angle of psi(i) axis to hinge axis
(deg) Angle of psi(i) axis to hinge axis
(deg) Percentage Progress
THR-414
TRP-415
11.8
11.7
4.7
-1.2
33.8
32.1
37.2
TRP-415
LEU-416
8.9
8.8
-5.0
9.9
83.1
84.0
27.8
LEU-416
ARG-417
5.2
5.2
4.6
-9.3
57.8
63.4
-2.7

Graph shows rotational transition at bending residues and can be used
to identify hinge bending residues.
Probably only informative for interdomain rotations greater than 20 degrees
Residue
iResidue
i+1Distance of hinge axis to residue i in
(A) Distance of hinge axis to residue i in
(A) Change in
(deg) Change in
(deg) Angle of psi(i) axis to hinge axis
(deg) Angle of psi(i) axis to hinge axis
(deg) Percentage Progress
GLU-437
LYS-438
5.7
5.6
-6.2
5.8
171.1
172.6
-17.9
LYS-438
LEU-439
4.5
4.4
-2.6
1.6
118.5
120.0
16.0
LEU-439
SER-440
3.5
3.6
-3.5
-2.8
95.5
92.3
27.4
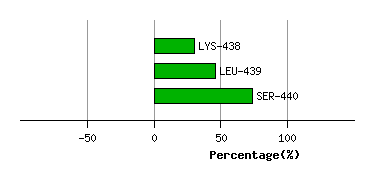
Graph shows rotational transition at bending residues and can be used
to identify hinge bending residues.
Probably only informative for interdomain rotations greater than 20 degrees