Capsular Polysaccharide Synthesis Enzyme Cap8e
(All numbering and residues are taken from first PDB file)
![]()
![]()
Bending Residue Dihedral Analysis
Residue
iResidue
i+1Distance of hinge axis to residue i in
(A) Distance of hinge axis to residue i in
(A) Change in
(deg) Change in
(deg) Angle of psi(i) axis to hinge axis
(deg) Angle of psi(i) axis to hinge axis
(deg) Percentage Progress
TYR-164
GLY-165
5.9
6.1
-2.0
-18.9
130.6
131.2
-57.0
GLY-165
ASN-166
5.3
5.7
47.4
-11.2
21.6
25.2
307.8
ASN-166
VAL-167
4.7
4.2
-4.2
-15.1
89.9
88.6
-133.3
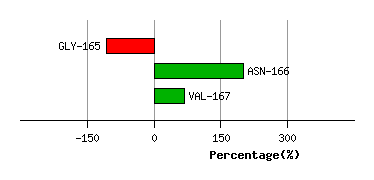
Graph shows rotational transition at bending residues and can be used
to identify hinge bending residues.
Probably only informative for interdomain rotations greater than 20 degrees
Residue
iResidue
i+1Distance of hinge axis to residue i in
(A) Distance of hinge axis to residue i in
(A) Change in
(deg) Change in
(deg) Angle of psi(i) axis to hinge axis
(deg) Angle of psi(i) axis to hinge axis
(deg) Percentage Progress
ASP-194
MET-195
18.1
16.8
1.0
5.5
75.1
83.2
25.9
MET-195
THR-196
15.3
14.5
0.0
-7.6
74.0
80.1
135.4
THR-196
ARG-197
12.1
11.0
3.1
5.3
101.9
102.1
-3.3
ARG-197
PHE-198
8.6
7.3
5.1
2.0
111.8
123.0
-7.1
ARG-197
PHE-198
8.6
7.3
5.1
2.0
111.8
123.0
-7.1

Graph shows rotational transition at bending residues and can be used
to identify hinge bending residues.
Probably only informative for interdomain rotations greater than 20 degrees
Residue
iResidue
i+1Distance of hinge axis to residue i in
(A) Distance of hinge axis to residue i in
(A) Change in
(deg) Change in
(deg) Angle of psi(i) axis to hinge axis
(deg) Angle of psi(i) axis to hinge axis
(deg) Percentage Progress
ARG-197
PHE-198
8.6
7.3
5.1
2.0
111.8
123.0
-7.1
ARG-197
PHE-198
8.6
7.3
5.1
2.0
111.8
123.0
-7.1
PHE-198
LEU-199
5.2
4.3
7.5
7.0
35.9
42.2
67.9
LEU-199
MET-200
4.0
4.0
-14.7
1.5
79.3
87.8
56.8
MET-200
SER-201
1.6
2.2
-6.3
-10.6
25.6
21.6
135.3
MET-200
SER-201
1.6
2.2
-6.3
-10.6
25.6
21.6
135.3

Graph shows rotational transition at bending residues and can be used
to identify hinge bending residues.
Probably only informative for interdomain rotations greater than 20 degrees
Residue
iResidue
i+1Distance of hinge axis to residue i in
(A) Distance of hinge axis to residue i in
(A) Change in
(deg) Change in
(deg) Angle of psi(i) axis to hinge axis
(deg) Angle of psi(i) axis to hinge axis
(deg) Percentage Progress
MET-200
SER-201
1.6
2.2
-6.3
-10.6
25.6
21.6
135.3
MET-200
SER-201
1.6
2.2
-6.3
-10.6
25.6
21.6
135.3
SER-201
LEU-202
3.9
4.4
5.8
-1.8
97.7
93.4
-33.3
LEU-202
GLU-203
5.4
6.1
-0.6
2.8
125.7
125.2
56.1
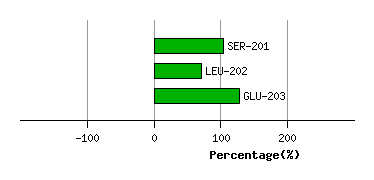
Graph shows rotational transition at bending residues and can be used
to identify hinge bending residues.
Probably only informative for interdomain rotations greater than 20 degrees
Residue
iResidue
i+1Distance of hinge axis to residue i in
(A) Distance of hinge axis to residue i in
(A) Change in
(deg) Change in
(deg) Angle of psi(i) axis to hinge axis
(deg) Angle of psi(i) axis to hinge axis
(deg) Percentage Progress
VAL-223
GLN-224
6.2
6.4
-12.2
11.8
84.2
82.9
33.0
GLN-224
LYS-225
3.8
4.2
-0.6
-3.4
74.9
76.9
85.7
LYS-225
ALA-226
1.2
1.9
-6.5
-0.9
142.3
140.1
-92.7
ALA-226
PRO-227
2.6
2.9
-5.2
11.4
85.7
83.3
13.8
PRO-227
SER-228
6.2
6.1
-2.2
9.5
135.5
134.7
38.9

Graph shows rotational transition at bending residues and can be used
to identify hinge bending residues.
Probably only informative for interdomain rotations greater than 20 degrees
Residue
iResidue
i+1Distance of hinge axis to residue i in
(A) Distance of hinge axis to residue i in
(A) Change in
(deg) Change in
(deg) Angle of psi(i) axis to hinge axis
(deg) Angle of psi(i) axis to hinge axis
(deg) Percentage Progress
ASP-233
LEU-234
16.0
15.6
-5.1
-6.7
126.3
129.6
-42.3
LEU-234
ALA-235
12.8
12.6
0.4
-0.2
23.7
22.5
12.4
ALA-235
THR-236
15.0
14.6
7.0
-4.1
89.8
89.9
34.7

Graph shows rotational transition at bending residues and can be used
to identify hinge bending residues.
Probably only informative for interdomain rotations greater than 20 degrees
Residue
iResidue
i+1Distance of hinge axis to residue i in
(A) Distance of hinge axis to residue i in
(A) Change in
(deg) Change in
(deg) Angle of psi(i) axis to hinge axis
(deg) Angle of psi(i) axis to hinge axis
(deg) Percentage Progress
ARG-254
HIS-255
19.6
21.0
-46.9
-3.8
126.0
135.5
-286.3
HIS-255
GLY-256
21.1
23.2
-58.4
61.2
112.0
98.4
-11.6
GLY-256
GLU-257
19.1
21.0
-26.6
81.0
116.3
94.6
268.8
GLU-257
LYS-258
16.9
17.3
2.2
24.5
37.6
25.3
124.5
LYS-258
LYS-259
16.6
14.8
-46.5
-1.8
87.8
107.6
70.1
LYS-259
ALA-260
16.6
15.1
4.2
-11.6
70.3
64.2
-17.7
ALA-260
GLU-261
13.4
11.8
28.3
-12.7
87.3
91.6
15.5
GLU-261
THR-262
10.9
9.2
-19.5
1.9
157.6
162.9
-147.2
THR-262
LEU-263
10.4
9.8
-17.0
9.4
83.8
90.2
33.1
LEU-263
LEU-264
7.7
7.6
-5.9
6.0
141.4
143.1
4.7

Graph shows rotational transition at bending residues and can be used
to identify hinge bending residues.
Probably only informative for interdomain rotations greater than 20 degrees
Residue
iResidue
i+1Distance of hinge axis to residue i in
(A) Distance of hinge axis to residue i in
(A) Change in
(deg) Change in
(deg) Angle of psi(i) axis to hinge axis
(deg) Angle of psi(i) axis to hinge axis
(deg) Percentage Progress
THR-312
HIS-313
7.6
7.4
-1.9
4.4
100.8
95.4
-14.2
HIS-313
ILE-314
9.5
9.1
-2.1
-4.3
161.4
163.6
-86.4
ILE-314
LEU-315
11.6
11.2
20.2
-26.6
66.4
71.6
98.1

Graph shows rotational transition at bending residues and can be used
to identify hinge bending residues.
Probably only informative for interdomain rotations greater than 20 degrees