Atp Synthase Subunit Beta
(All numbering and residues are taken from first PDB file)
![]()
![]()
Bending Residue Dihedral Analysis
Residue
iResidue
i+1Distance of hinge axis to residue i in
(A) Distance of hinge axis to residue i in
(A) Change in
(deg) Change in
(deg) Angle of psi(i) axis to hinge axis
(deg) Angle of psi(i) axis to hinge axis
(deg) Percentage Progress
GLU-129
GLN-130
17.2
18.1
-35.9
32.8
73.1
70.1
55.8
GLN-130
GLU-131
14.7
15.3
-49.6
32.9
98.0
95.3
27.8
GLU-131
ILE-132
14.3
14.7
-57.9
57.9
65.2
77.0
19.7
ILE-132
LEU-133
12.8
12.8
-13.8
27.8
132.4
138.3
96.8
LEU-133
VAL-134
11.5
11.5
-0.2
4.7
64.6
63.9
-41.6
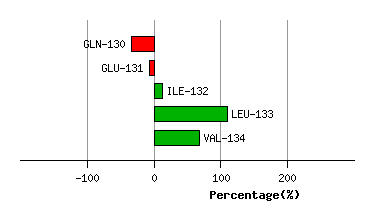
Graph shows rotational transition at bending residues and can be used
to identify hinge bending residues.
Probably only informative for interdomain rotations greater than 20 degrees
Residue
iResidue
i+1Distance of hinge axis to residue i in
(A) Distance of hinge axis to residue i in
(A) Change in
(deg) Change in
(deg) Angle of psi(i) axis to hinge axis
(deg) Angle of psi(i) axis to hinge axis
(deg) Percentage Progress
GLY-149
GLY-150
8.2
8.0
13.9
4.9
51.3
46.2
91.7
GLY-150
LYS-151
6.3
6.2
-16.3
11.7
81.8
85.9
-32.5
LYS-151
ILE-152
3.3
3.3
0.5
8.1
30.8
34.5
57.5
ILE-152
GLY-153
0.5
0.6
10.5
-7.5
95.3
94.4
-22.4
ILE-152
GLY-153
0.5
0.6
10.5
-7.5
95.3
94.4
-22.4

Graph shows rotational transition at bending residues and can be used
to identify hinge bending residues.
Probably only informative for interdomain rotations greater than 20 degrees
Residue
iResidue
i+1Distance of hinge axis to residue i in
(A) Distance of hinge axis to residue i in
(A) Change in
(deg) Change in
(deg) Angle of psi(i) axis to hinge axis
(deg) Angle of psi(i) axis to hinge axis
(deg) Percentage Progress
ILE-152
GLY-153
0.5
0.6
10.5
-7.5
95.3
94.4
-22.4
ILE-152
GLY-153
0.5
0.6
10.5
-7.5
95.3
94.4
-22.4
GLY-153
LEU-154
3.1
2.9
-13.1
17.3
68.1
69.1
23.5
LEU-154
PHE-155
5.7
5.6
-17.9
21.8
64.4
55.7
95.3

Graph shows rotational transition at bending residues and can be used
to identify hinge bending residues.
Probably only informative for interdomain rotations greater than 20 degrees
Residue
iResidue
i+1Distance of hinge axis to residue i in
(A) Distance of hinge axis to residue i in
(A) Change in
(deg) Change in
(deg) Angle of psi(i) axis to hinge axis
(deg) Angle of psi(i) axis to hinge axis
(deg) Percentage Progress
ASN-171
ASN-172
15.0
14.7
14.0
-16.7
74.9
64.0
23.9
ASN-172
VAL-173
15.3
14.8
11.0
-12.5
123.2
110.3
-28.6
VAL-173
ALA-174
12.9
12.3
-140.8
118.8
24.1
21.7
203.9
ALA-174
LYS-175
15.3
13.5
-109.8
90.5
101.1
87.0
26.2
LYS-175
ALA-176
17.1
17.2
83.2
-58.2
103.0
73.5
-58.2
ALA-176
HIS-177
17.3
17.2
94.6
-80.2
127.7
108.7
-31.4
HIS-177
GLY-178
14.6
14.9
-28.2
-33.9
37.2
13.2
398.2
GLY-178
GLY-179
13.9
14.2
37.2
-178.0
80.4
101.3
-290.1
GLY-179
TYR-180
12.1
10.4
125.1
-1.8
120.3
86.7
-367.3
TYR-180
SER-181
9.0
8.5
38.3
9.8
49.4
47.5
200.0
SER-181
VAL-182
6.8
6.4
1.1
0.9
123.5
120.5
17.0
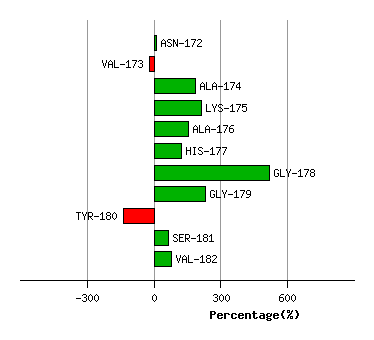
Graph shows rotational transition at bending residues and can be used
to identify hinge bending residues.
Probably only informative for interdomain rotations greater than 20 degrees
Residue
iResidue
i+1Distance of hinge axis to residue i in
(A) Distance of hinge axis to residue i in
(A) Change in
(deg) Change in
(deg) Angle of psi(i) axis to hinge axis
(deg) Angle of psi(i) axis to hinge axis
(deg) Percentage Progress
ALA-331
THR-332
2.9
3.1
-13.1
10.5
90.3
95.8
15.1
THR-332
THR-333
1.1
1.1
-22.2
22.1
79.3
80.1
33.8
THR-333
VAL-334
4.9
4.9
0.9
14.3
111.6
112.6
-5.8
VAL-334
LEU-335
6.7
6.8
2.9
-6.3
100.8
89.9
16.6
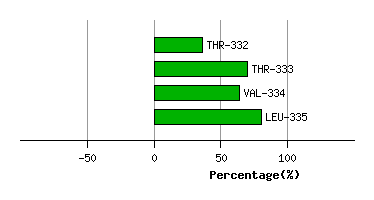
Graph shows rotational transition at bending residues and can be used
to identify hinge bending residues.
Probably only informative for interdomain rotations greater than 20 degrees
Residue
iResidue
i+1Distance of hinge axis to residue i in
(A) Distance of hinge axis to residue i in
(A) Change in
(deg) Change in
(deg) Angle of psi(i) axis to hinge axis
(deg) Angle of psi(i) axis to hinge axis
(deg) Percentage Progress
LEU-351
ASP-352
6.2
6.3
-33.6
43.0
70.2
67.5
-43.9
ASP-352
SER-353
3.8
4.1
-49.0
40.5
23.9
31.5
61.1
SER-353
THR-354
3.6
4.1
-7.5
6.7
97.1
102.4
11.0
THR-354
SER-355
3.7
3.5
-7.9
-4.4
150.7
148.4
-67.2
THR-354
SER-355
3.7
3.5
-7.9
-4.4
150.7
148.4
-67.2

Graph shows rotational transition at bending residues and can be used
to identify hinge bending residues.
Probably only informative for interdomain rotations greater than 20 degrees
Residue
iResidue
i+1Distance of hinge axis to residue i in
(A) Distance of hinge axis to residue i in
(A) Change in
(deg) Change in
(deg) Angle of psi(i) axis to hinge axis
(deg) Angle of psi(i) axis to hinge axis
(deg) Percentage Progress
THR-354
SER-355
3.7
3.5
-7.9
-4.4
150.7
148.4
-67.2
THR-354
SER-355
3.7
3.5
-7.9
-4.4
150.7
148.4
-67.2
SER-355
ARG-356
6.1
5.8
11.6
-13.5
98.5
105.2
21.9
ARG-356
ILE-357
8.3
8.4
-41.9
88.9
92.3
93.0
34.8

Graph shows rotational transition at bending residues and can be used
to identify hinge bending residues.
Probably only informative for interdomain rotations greater than 20 degrees