S-Adenosylmethionine Synthetase Isoform Type-1
(All numbering and residues are taken from first PDB file)
![]()
![]()
Bending Residue Dihedral Analysis
Residue
iResidue
i+1Distance of hinge axis to residue i in
(A) Distance of hinge axis to residue i in
(A) Change in
(deg) Change in
(deg) Angle of psi(i) axis to hinge axis
(deg) Angle of psi(i) axis to hinge axis
(deg) Percentage Progress
VAL-106
LEU-107
25.1
25.5
-23.3
25.1
125.8
131.8
-61.1
LEU-107
VAL-108
25.2
25.8
-21.1
28.4
94.3
96.6
-1.7
VAL-108
ALA-109
22.4
22.6
-5.9
10.7
105.9
112.9
-29.4
ALA-109
LEU-110
22.7
22.8
-33.8
32.0
90.6
94.9
45.5
LEU-110
GLU-111
19.3
19.2
8.8
14.8
38.8
26.0
203.7
GLU-111
GLN-112
19.1
18.5
-45.7
-52.3
92.3
102.4
-136.7
GLN-112
GLN-113
16.9
15.1
-41.0
-28.6
40.1
144.7
-128.0
GLN-113
SER-114
16.4
14.0
65.8
-88.0
70.0
65.9
-255.8
SER-114
PRO-115
19.7
10.7
-179.6
-32.6
119.3
87.6
453.6
GLU-128
ASP-129
14.3
14.2
-7.4
-2.0
64.3
58.5
30.6
ASP-129
VAL-130
16.4
16.8
9.0
8.9
82.7
79.1
53.5
VAL-130
GLY-131
14.1
15.1
149.3
-160.6
145.4
119.8
15.4
GLY-131
ALA-132
16.0
16.6
-34.2
-1.0
53.2
67.6
21.5
ALA-132
GLY-133
14.8
15.5
-4.8
-16.9
114.1
104.6
-117.0
GLY-133
ASP-134
14.1
16.0
147.2
-127.9
118.5
153.1
-166.5

Graph shows rotational transition at bending residues and can be used
to identify hinge bending residues.
Probably only informative for interdomain rotations greater than 20 degrees
Residue
iResidue
i+1Distance of hinge axis to residue i in
(A) Distance of hinge axis to residue i in
(A) Change in
(deg) Change in
(deg) Angle of psi(i) axis to hinge axis
(deg) Angle of psi(i) axis to hinge axis
(deg) Percentage Progress
MET-150
PRO-151
3.7
3.8
-8.8
13.7
156.7
155.1
46.2
PRO-151
LEU-152
2.8
2.9
-3.8
2.9
94.5
95.8
36.2
LEU-152
THR-153
6.3
6.4
-6.1
6.2
84.4
81.4
-116.9

Graph shows rotational transition at bending residues and can be used
to identify hinge bending residues.
Probably only informative for interdomain rotations greater than 20 degrees
Residue
iResidue
i+1Distance of hinge axis to residue i in
(A) Distance of hinge axis to residue i in
(A) Change in
(deg) Change in
(deg) Angle of psi(i) axis to hinge axis
(deg) Angle of psi(i) axis to hinge axis
(deg) Percentage Progress
VAL-186
GLN-187
7.8
8.1
-1.7
1.1
39.8
45.6
-73.6
GLN-187
TYR-188
6.1
6.2
9.9
-3.5
80.4
81.8
76.7
TYR-188
MET-189
2.8
2.7
29.3
-51.6
143.3
143.6
144.3
MET-189
GLN-190
2.4
1.8
-38.8
52.2
128.3
122.0
86.6

Graph shows rotational transition at bending residues and can be used
to identify hinge bending residues.
Probably only informative for interdomain rotations greater than 20 degrees
Residue
iResidue
i+1Distance of hinge axis to residue i in
(A) Distance of hinge axis to residue i in
(A) Change in
(deg) Change in
(deg) Angle of psi(i) axis to hinge axis
(deg) Angle of psi(i) axis to hinge axis
(deg) Percentage Progress
ALA-194
VAL-195
7.3
7.2
-9.5
165.3
119.0
80.3
30.5
VAL-195
ILE-196
3.9
3.8
-52.5
17.3
86.4
93.5
-128.3
ILE-196
PRO-197
5.4
5.0
2.8
-5.8
74.8
77.3
7.2
PRO-197
VAL-198
6.0
5.6
4.6
0.0
38.7
41.7
47.6

Graph shows rotational transition at bending residues and can be used
to identify hinge bending residues.
Probably only informative for interdomain rotations greater than 20 degrees
Residue
iResidue
i+1Distance of hinge axis to residue i in
(A) Distance of hinge axis to residue i in
(A) Change in
(deg) Change in
(deg) Angle of psi(i) axis to hinge axis
(deg) Angle of psi(i) axis to hinge axis
(deg) Percentage Progress
VAL-251
ILE-252
32.4
32.3
-24.6
-8.7
142.7
154.8
-339.1
ILE-252
GLY-253
31.7
32.7
-110.5
114.2
84.4
87.2
22.2
GLY-253
GLY-254
28.0
29.8
95.6
-11.3
21.9
28.0
821.6
GLY-254
PRO-255
25.6
27.6
-24.7
-21.8
103.6
95.3
-79.2
PRO-255
GLN-256
26.2
25.5
124.9
-76.0
104.2
73.0
101.7
GLN-256
GLY-257
29.9
27.6
-19.2
109.9
22.9
55.5
-795.8
GLY-257
ASP-258
29.0
26.5
59.2
-126.6
95.9
72.0
-372.1
ASP-258
ALA-259
26.5
28.9
-146.2
-126.0
152.8
142.7
903.1
ALA-259
GLY-260
25.6
26.0
5.8
-0.7
95.3
99.0
-45.0
GLY-260
VAL-261
22.0
22.4
-14.8
4.8
130.1
126.0
-104.9
VAL-261
THR-262
19.8
20.1
13.8
-25.1
91.9
89.8
-10.3
THR-262
GLY-263
16.1
16.5
5.9
1.9
125.5
120.3
-83.8
GLY-263
ARG-264
14.2
14.6
-16.8
8.5
30.6
24.1
76.6

Graph shows rotational transition at bending residues and can be used
to identify hinge bending residues.
Probably only informative for interdomain rotations greater than 20 degrees
Residue
iResidue
i+1Distance of hinge axis to residue i in
(A) Distance of hinge axis to residue i in
(A) Change in
(deg) Change in
(deg) Angle of psi(i) axis to hinge axis
(deg) Angle of psi(i) axis to hinge axis
(deg) Percentage Progress
ALA-281
PHE-282
11.4
11.3
6.9
-9.2
51.7
43.3
5.8
PHE-282
SER-283
8.1
8.4
-5.5
12.1
143.6
141.1
34.6
SER-283
GLY-284
9.6
9.9
-6.9
8.3
141.4
138.6
-16.8
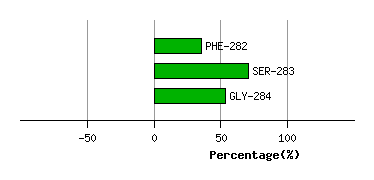
Graph shows rotational transition at bending residues and can be used
to identify hinge bending residues.
Probably only informative for interdomain rotations greater than 20 degrees
Residue
iResidue
i+1Distance of hinge axis to residue i in
(A) Distance of hinge axis to residue i in
(A) Change in
(deg) Change in
(deg) Angle of psi(i) axis to hinge axis
(deg) Angle of psi(i) axis to hinge axis
(deg) Percentage Progress
GLY-358
VAL-359
11.4
11.0
-25.7
27.7
102.2
106.1
116.9
VAL-359
ILE-360
12.2
12.1
6.7
-11.7
55.5
53.4
23.7
ILE-360
VAL-361
9.4
9.2
-7.8
-4.8
54.6
57.7
125.5
VAL-361
ARG-362
6.9
6.5
1.1
4.4
106.0
115.4
-104.0
ARG-362
ASP-363
9.4
8.9
4.2
-8.7
39.0
49.0
-51.0
ASP-363
LEU-364
10.3
10.3
5.7
14.8
71.8
64.3
111.8

Graph shows rotational transition at bending residues and can be used
to identify hinge bending residues.
Probably only informative for interdomain rotations greater than 20 degrees
Residue
iResidue
i+1Distance of hinge axis to residue i in
(A) Distance of hinge axis to residue i in
(A) Change in
(deg) Change in
(deg) Angle of psi(i) axis to hinge axis
(deg) Angle of psi(i) axis to hinge axis
(deg) Percentage Progress
ASP-365
LEU-366
6.0
6.4
5.0
1.2
86.1
92.6
16.7
LEU-366
LYS-367
2.5
2.7
3.7
-7.5
37.2
36.0
58.1
LYS-367
LYS-368
1.3
1.8
1.7
-6.7
87.4
86.8
-70.1
LYS-368
PRO-369
4.2
4.6
5.8
0.9
71.6
68.7
51.0
LYS-368
PRO-369
4.2
4.6
5.8
0.9
71.6
68.7
51.0

Graph shows rotational transition at bending residues and can be used
to identify hinge bending residues.
Probably only informative for interdomain rotations greater than 20 degrees
Residue
iResidue
i+1Distance of hinge axis to residue i in
(A) Distance of hinge axis to residue i in
(A) Change in
(deg) Change in
(deg) Angle of psi(i) axis to hinge axis
(deg) Angle of psi(i) axis to hinge axis
(deg) Percentage Progress
LYS-368
PRO-369
4.2
4.6
5.8
0.9
71.6
68.7
51.0
LYS-368
PRO-369
4.2
4.6
5.8
0.9
71.6
68.7
51.0
PRO-369
ILE-370
5.9
6.3
6.6
2.5
37.0
31.3
83.9
ILE-370
TYR-371
7.0
6.9
-14.7
16.9
130.3
124.4
-47.8

Graph shows rotational transition at bending residues and can be used
to identify hinge bending residues.
Probably only informative for interdomain rotations greater than 20 degrees
Residue
iResidue
i+1Distance of hinge axis to residue i in
(A) Distance of hinge axis to residue i in
(A) Change in
(deg) Change in
(deg) Angle of psi(i) axis to hinge axis
(deg) Angle of psi(i) axis to hinge axis
(deg) Percentage Progress
GLU-384
PHE-385
10.5
10.6
15.4
-17.7
63.4
55.1
27.0
PHE-385
PRO-386
6.9
7.1
-4.9
10.9
85.6
88.9
-23.5
PRO-386
TRP-387
7.6
7.5
-11.4
4.1
44.1
41.7
55.5
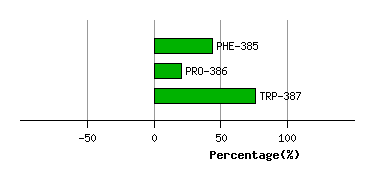
Graph shows rotational transition at bending residues and can be used
to identify hinge bending residues.
Probably only informative for interdomain rotations greater than 20 degrees