Beta-Secretase 1
(All numbering and residues are taken from first PDB file)
![]()
![]()
Bending Residue Dihedral Analysis
Residue
iResidue
i+1Distance of hinge axis to residue i in
(A) Distance of hinge axis to residue i in
(A) Change in
(deg) Change in
(deg) Angle of psi(i) axis to hinge axis
(deg) Angle of psi(i) axis to hinge axis
(deg) Percentage Progress
ALA-42
ALA-43
5.6
5.3
4.3
-10.3
65.8
66.4
20.9
ALA-43
PRO-44
6.3
6.2
-6.7
30.4
149.4
144.8
55.8
PRO-44
HIS-45
6.1
5.8
81.4
-96.3
81.3
97.7
-31.6

Graph shows rotational transition at bending residues and can be used
to identify hinge bending residues.
Probably only informative for interdomain rotations greater than 20 degrees
Residue
iResidue
i+1Distance of hinge axis to residue i in
(A) Distance of hinge axis to residue i in
(A) Change in
(deg) Change in
(deg) Angle of psi(i) axis to hinge axis
(deg) Angle of psi(i) axis to hinge axis
(deg) Percentage Progress
HIS-49
ARG-50
3.8
3.4
26.0
-29.5
62.5
62.8
-78.6
ARG-50
TYR-51
6.2
5.8
11.5
-10.4
26.9
14.5
84.2
TYR-51
TYR-52
6.2
6.0
1.6
12.9
60.9
58.9
33.0

Graph shows rotational transition at bending residues and can be used
to identify hinge bending residues.
Probably only informative for interdomain rotations greater than 20 degrees
Residue
iResidue
i+1Distance of hinge axis to residue i in
(A) Distance of hinge axis to residue i in
(A) Change in
(deg) Change in
(deg) Angle of psi(i) axis to hinge axis
(deg) Angle of psi(i) axis to hinge axis
(deg) Percentage Progress
LYS-65
GLY-66
6.3
5.9
-0.3
1.6
144.3
139.2
14.2
GLY-66
VAL-67
4.6
4.3
1.0
-16.2
100.8
101.1
58.4
VAL-67
TYR-68
1.6
1.7
-7.7
19.2
123.7
130.8
29.3
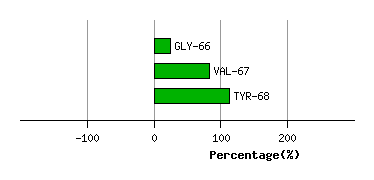
Graph shows rotational transition at bending residues and can be used
to identify hinge bending residues.
Probably only informative for interdomain rotations greater than 20 degrees
Residue
iResidue
i+1Distance of hinge axis to residue i in
(A) Distance of hinge axis to residue i in
(A) Change in
(deg) Change in
(deg) Angle of psi(i) axis to hinge axis
(deg) Angle of psi(i) axis to hinge axis
(deg) Percentage Progress
TRP-76
GLU-77
5.0
5.5
1.7
25.5
33.5
32.5
144.9
GLU-77
GLY-78
4.0
4.3
-6.3
29.1
78.7
73.5
-28.7
GLY-78
GLU-79
3.5
2.6
-11.9
-4.3
141.4
140.0
-75.8

Graph shows rotational transition at bending residues and can be used
to identify hinge bending residues.
Probably only informative for interdomain rotations greater than 20 degrees
Residue
iResidue
i+1Distance of hinge axis to residue i in
(A) Distance of hinge axis to residue i in
(A) Change in
(deg) Change in
(deg) Angle of psi(i) axis to hinge axis
(deg) Angle of psi(i) axis to hinge axis
(deg) Percentage Progress
ALA-101
ILE-102
4.9
4.3
0.0
2.5
97.7
100.1
21.4
ILE-102
THR-103
2.0
1.6
5.6
-5.4
62.4
62.7
9.4
THR-103
GLU-104
5.3
5.1
-5.0
18.6
110.0
108.6
39.4

Graph shows rotational transition at bending residues and can be used
to identify hinge bending residues.
Probably only informative for interdomain rotations greater than 20 degrees
Residue
iResidue
i+1Distance of hinge axis to residue i in
(A) Distance of hinge axis to residue i in
(A) Change in
(deg) Change in
(deg) Angle of psi(i) axis to hinge axis
(deg) Angle of psi(i) axis to hinge axis
(deg) Percentage Progress
PHE-108
PHE-109
7.7
8.3
2.4
0.2
143.8
142.5
0.4
PHE-109
ILE-110
6.0
6.4
0.7
-15.2
135.6
138.3
85.1
ILE-110
ASN-111
8.4
8.6
0.1
5.6
151.1
151.6
-50.6

Graph shows rotational transition at bending residues and can be used
to identify hinge bending residues.
Probably only informative for interdomain rotations greater than 20 degrees